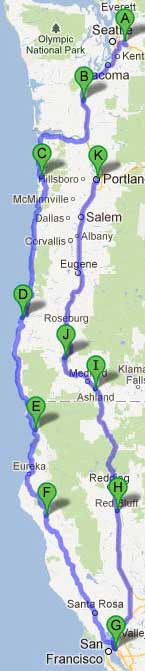
Cathy and I took an 1,823-mile electric vehicle road trip to attend the Plug In America board meeting in Berkeley, CA, on June 23rd, 2012. Ever since we took delivery of our Tesla Roadster in June of 2009, I've wanted to take it on a long road trip just to have the experience. Over the past three years, the challenge of making the drive from Seattle to California has been greatly reduced. When Rich Kaethler took delivery of his Roadster in San Carlos, CA, and drove it back to Seattle in August of 2009, and Chad Schwitters made his long trek from Seattle to San Diego and back in April of 2010, these were pioneering efforts. Now we have full speed (240V/70A) Tesla charging along I-5 from British Columbia to southern California, which makes it possible to do the Seattle-to-San Francisco drive electrically in just a couple of days.
However, Cathy and I wanted to take a more leisurely approach and add some new territory to the EV road trip experience, so we made our way down the Oregon and California coast on highway 101, eschewing the more convenient charging established on I-5. Here's what we did, what we learned, and a few adventures we had along the way.
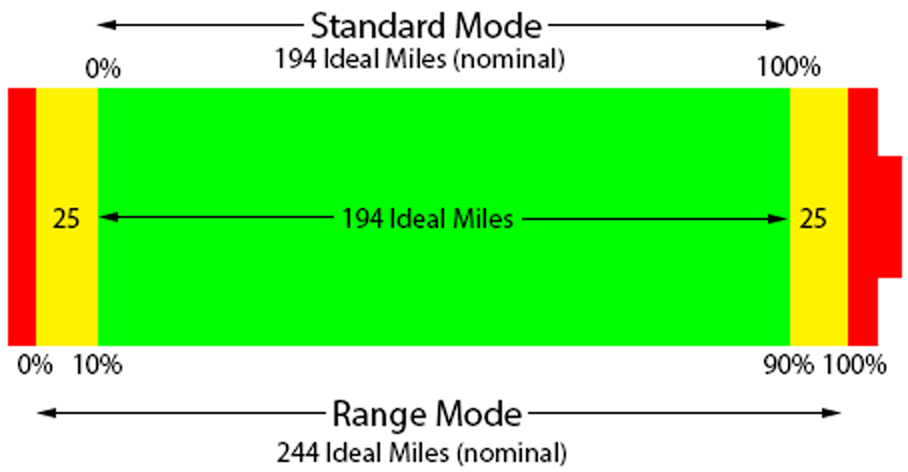
Our Tesla Roadster has a range of about 240 miles at 55 to 60 mph on level freeway in moderate weather. In practical terms, that means we can generally drive 180 to 200 miles without any need to charge in the middle. About four hours of driving per day is our threshold for convenient travel and leaves plenty of time to enjoy a leisurely drive and see the sights, which works well with the Roadster's single charge range.
The coastal drive is a bit of a challenge because there is almost no installed public charging infrastructure. Fortunately, all we need is a power source, and one of the best sources for power is the 240V/50A service commonly available at RV parks. Finding charging is actually pretty easy; the challenge is finding a place to charge and a place to sleep nearby. Cathy did careful planning in advance, finding hotels and motels that either provided charging or were adjacent to EV-friendly RV parks.
Day 1 Because we had a four-hour delay from our intended start time, we cheated and took the easy route south down I-5 toward Portland, taking advantage of 70A charging while eating lunch at
Burgerville in Centralia. That gave us enough juice to remove any chance of range concern for our 237-mile drive.
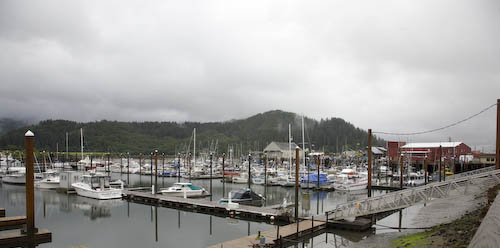
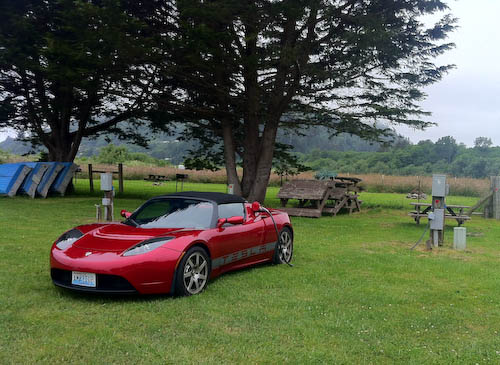
For our first night, Cathy found what turned out to be a wonderful location, the
Harborview Inn and RV Park in Garibaldi, OR. The Inn is a modest little motel, but it and the RV park are right on the harbor, which was hard to appreciate when we arrived shortly after sunset, but treated us to a beautiful view as fog was lifting from the harbor when we woke up in the morning.
The restaurant options in Garibaldi were pretty limited, so we got dinner in Seaside on the way, then ate breakfast in a dodgy little place in Bay City.
Day 2 We made a couple of stops in Lincoln City where there are two locations with two ChargePoint charging stations each. We didn't find much to do near either location, and we didn't really need to charge, so we took off after a quick bit of exploring.
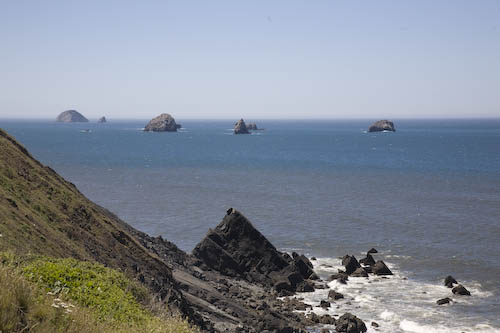
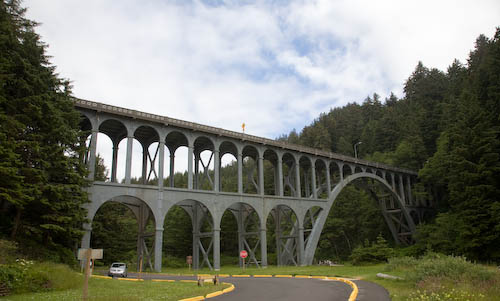
Cathy found some information online about the many wonderful historic bridges along the Oregon coast, so we made that our theme for the drive. One of our favorites was Cape Creek Bridge.
That night we charged at
Charleston Marina RV Park in Charleston, OR. It cost us $23 to use an RV spot to charge overnight, but the folks were very nice and the manager expressed interest in installing EV charging stations. It was fortunate that we had a suite with a full kitchen at
Charleston Harbor Inn, because there was very little in the way of restaurants open at the late hour of 5 pm on a Tuesday night. We bought some food at the local convenience store and made dinner.
Day 3 We took in the last of the Oregon coast historic bridges then crossed over into California with a quick stop at the Redwood National Park visitor information center in Crescent City. We stopped for a walk in the forest and a drive up to an overlook of the mouth of the Klamath River to watch gray whales feeding. Late that afternoon, we rolled into the
Chinook RV Resort in Klamath, CA. They had all brand new 50A service in nice pretty enclosures that have a bar running right below the outlet, which prevented us from plugging in. The very helpful handyman was able to "modify" the enclosure on spot #2 so that we could plug in.
Restaurant options in Klamath are very limited. One place had a big sign out front that said "Now Open" which, as we found out, isn't the same as "Open Now"; they seem to only be open from 11:00 am to 2:00 pm for "breakfast." Another place had people loitering out front and a sign that said "armed guard on duty." That didn't sound very inviting! Again, we had a suite with a kitchen at the RV park, but we didn't have groceries and the only store open in town is a gas station convenience store. We ate at Steelhead Lodge, which is not even a little bit vegetarian friendly. Cathy asked for a baked potato with cheese and was told "we don't have cheese." Definitely, another good place to make dinner in the suite; be sure to do your shopping in Crescent City.
Day 4 Was our most fun driving day, taking the
Avenue of the Giants, a portion of the old Highway 101 running parallel to 101, to drive through the Redwoods. Driving a quiet electric car on a road surrounded by the forest canopy was one of my top 2 all time Roadster drives. We also had probably our best meal of the trip, lunch at the wonderful vegetarian
Wildflower Cafe and Bakery in Arcata, CA.
We spent the night at the historic
Benbow Inn in Garberville, CA. They feature biscuits and tea in the afternoon, an elegant dining room serving a seasonal menu, a rich event calendar (an outdoor jazz concert the night we were there), and free EV charging via a 50A outlet. There's also an associated RV park, which we planned to use until we learned about the hotel charging option. It was the priciest hotel we stayed at, but we just couldn't resist trying out a previously unknown EV-friendly hotel.
Day 5 We needed to drive 213 miles. Just to be safe, we stopped at what turned out to be two SemaCharge stations at Coddingtown Mall in Santa Rosa, CA. Although we'd heard reports that SemaCharge stations don't work with 2010 and later (v2.x) Tesla Roadsters, we were quite pleasantly surprised to find the one we tried worked flawlessly with our 2008 (v1.5) Roadster.
For our hotel in the Bay area, we chose the
Four Points Sheraton in Emeryville because it was the closest EV-charging hotel to the Plug In America board meeting in Berkeley. (How can Berkeley not have a ton of public charging? What's up with that?)
Unfortunately, we weren't the only ones to figure out that this is the only charging station near Berkeley as we were unable to use the level 2 ChargePoint station until over 12 hours after our arrival. When we arrived, there was a Volt charging. While we were out for dinner, a Leaf pulled in and started charging from near empty. I happened to wake up way too early and could see the Leaf had finished, so I dashed down to start charging at 5:25 am. I didn't want to leave our very expensive adapter cable out all day, so I took a chance and unplugged when I left to take the bus to the board meeting. Fortunately, I was able to plug back in that evening, finish the charge that night, and top off again in the morning. When we left, a plug-in Prius was using the Level 1 station. When we got home, I checked the data from my Plug In America charging infrastructure study and found that station is one of the most-used ChargePoint stations in the country, averaging 11 hours of use per day.
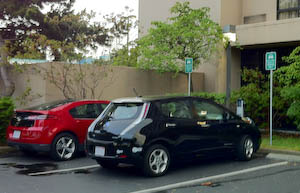
Neither the Leaf nor the Volt were driven by hotel guests, and the hotel staff was completely unconcerned that a guest was blocked from charging for over 12 hours. "Those stations are there for the public to use." That's all good, but we chose the hotel because of the charging station. Because of the high use rate, and no preference given to guests, I can't recommend this hotel for a single night stay where charging an EV is required.
Day 6 I attended the board meeting. Cathy visited the
California Academy of Sciences at Golden Gate Park and had a quite an adventure with the bay area bus systems, but that could be a blog all on its own.
Day 7 There are a series of Tesla charging stations along I-5 making it possible to drive from the Bay Area to Seattle in two days. We wanted a more leisurely experience, so didn't need use any of them until we were almost home. Our first overnight was in Red Bluff, CA. We stayed at a Super 8 motel and charged across the street at the Rivers Edge RV Resort where we had another adventure. They claimed to have three 50A outlets, but we had to scrounge through the park to find them. We tried five that didn't have power until we finally found success with the sixth. The manager and the park handyman were very supportive and helpful. We ate a tasty late lunch at the
New Thai House; the Yelp reviews weren't kidding that the food is spicy. We also took in a movie at the local cinema.
Day 8 In Red Bluff, the
Tremont Cafe and Creamery is a decent place for breakfast, although we enjoyed the historical notes on the menu more than the missing-in-action service.
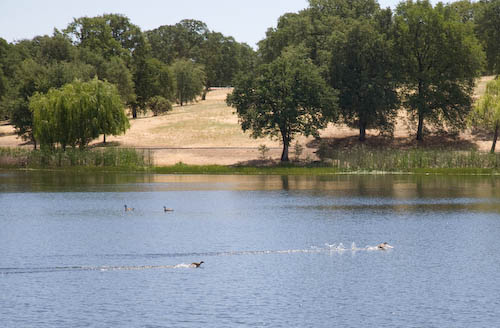
Although we only needed to drive 176 miles to Ashland, OR, we had to climb over the Siskiyous Mountains which means climbing to 4,000 feet, dropping back down to 2,000 then up again to 4,000. We could have done it on a single charge, but decided to try out a charging site in Redding, CA, while taking a walk through the adjacent
Lema Ranch Trails.
The Blink charging station was only delivering 187V (normally it's around either 208V or 240V), so we were only charging at about 75% of the rate we expected. This was fine for what we needed, but not so good if you're counting on a more typical Level 2 charging rate.
Historical note: while crossing the Siskiyous, we saw Tony Williams' Nissan Leaf speed by southbound, making the return trip from his BC2BC tour.
We arrived at the
Chanticleer Inn in Ashland, OR, with plenty of charge remaining (25%) despite the serious elevation climbs along the way. Although there is a Level 2 station in Ashland, we arranged with Ellen at the B&B to charge from a 120V outlet. Since we were going to be there for 2 days, that was enough to get us charged (28.5 hours).
Day 9 We were in town to watch three shows at the Oregon Shakespeare Festival, so we spent a second night in Ashland and had a great time. Ellen was very accommodating, both of our charging needs and our vegetarian diet. She even invited a friend over to see the Roadster which turned into an impromptu car show for our breakfast mates from the inn. It was a much more pleasant stay than at the hotel with the oversubscribed Level 2 charging station.
Day 10 We had a full charge and only a 60-mile drive, so we got to enjoy full-blast air conditioning on a hot day, driving up and down a couple of mountain passes in the left lane not sparing the accelerator pedal at all. I tried to show some restraint, but I have to admit it was more fun for me behind the wheel than for Cathy in the passenger seat.
We charged at the Level 2 AeroVironment station next to the DC Fast Charger while spending the night at the historic
Wolf Creek Inn.
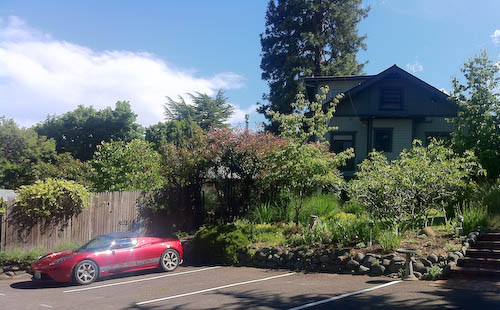
Day 11 Nearing the home stretch, we detoured to Corvallis, OR, to visit a friend from the EV community who generously allowed us to charge in his garage while we went out for lunch and had a wide ranging chat about EVs, wacky diets, and lots more.
In Portland, we met up with John Wayland and had dinner with John and his daughter Marissa at our favorite neighborhood Thai place in Portland, Thanh Thao. Sadly, the wonderful
Jaciva's chocolate shop and dessert bakery had closed too early for us to visit.
We had another adventure in charging at the Downtown Crowne Plaza. They have two Blink stations, which we've used before without issue. That night, we started a charge at 10:27 pm and hit the sack. At 11:58, my cell phone woke us up with an alert that the charge session had ended abnormally. Concerned that someone might be messing with the car or the adapter cable, I dashed out to check. Nothing was disturbed, but something had terminated the charge session. I can't say for sure whether the Blink station burped, or someone messed with the locking switch on the Tesla connector (and put it back), but I was very pleased that I had an
OVMS box (similar to the
Tesla Tattler) installed and set to text me if a charge is interrupted. Without that notice, we would have found a partially charged car in the morning and then had to wait five hours before we could depart.
Day 12 We made our usual 30-minute stop at
Burgerville in Centralia, WA, for a quick bit of charge and a meal. We totally dig Burgerville for their healthy fare, including vegetarian options, environmental consciousness, and especially for the Tesla charging station they have provided since 2010. From there, it was an easy drive home.
 Today, October 23, 2017, Jose pulled up in front of our house in a beautiful blue Nissan LEAF for our test drive. We spent about an hour going over the vehicle and then out for a drive. Jose was enthusiastic and very knowledgeable about the car. We have a 2011 LEAF, so I'm familiar with that but haven't driven any of the newer LEAFs, so that's my perspective.
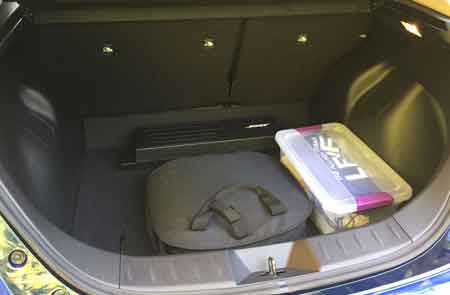
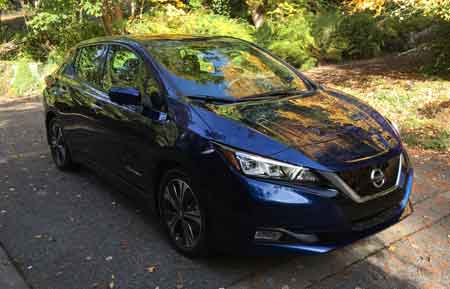 Back Seat
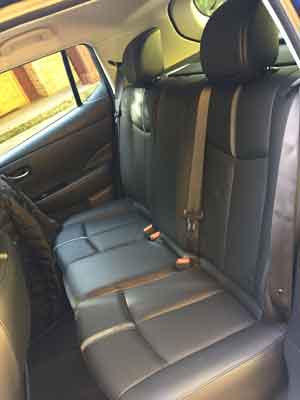 Charge Cord
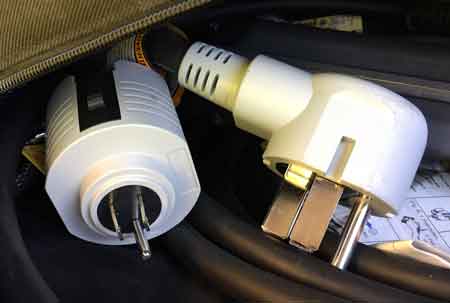 With so much public charging available now, there's not much need for Level 2 charging away from home, but the dual mode cord means an owner can upgrade their home charging to 240V by just installing a NEMA 15-40 outlet.
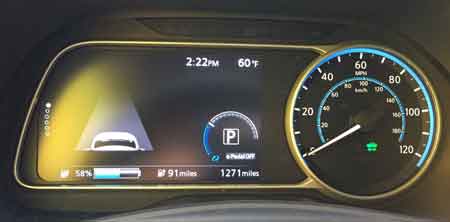 ProPilot
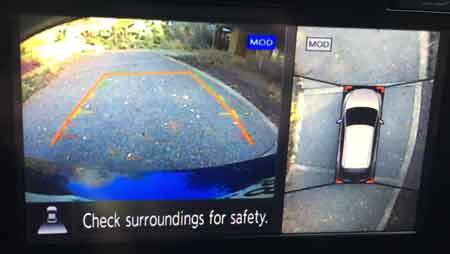 Bluetooth Audio